
ABC customer analysis: what it is, how to build it and how to use it in wholesale
For the distributor with 200 or 2,000 accounts that serves everyone the same way and does not know which ones hold the business up. What ABC analysis is, how to build it in five steps with a spreadsheet, what to do with each class and why most curves get built once and never used.
There is a question we ask at almost every first meeting with a distributor: "which are your ten most important customers?". The owner names them from memory and usually gets seven or eight right. Then we ask what share of total sales they represent, and the answer changes: "I don’t know, a lot". And the third question, how many visits, discounts and rep hours each of those ten takes compared with the other 190, nobody can answer.
ABC customer analysis answers those three questions with a spreadsheet and an afternoon’s work. It is not a new technique, it comes from the 1950s and from inventory management, but applied to customers it is the cheapest tool we know for deciding who the rep visits, who gets credit, who gets the catalog and who should be left to order on their own. This article explains what it is, how to build it step by step and, above all, what to do afterwards.
What is ABC customer analysis
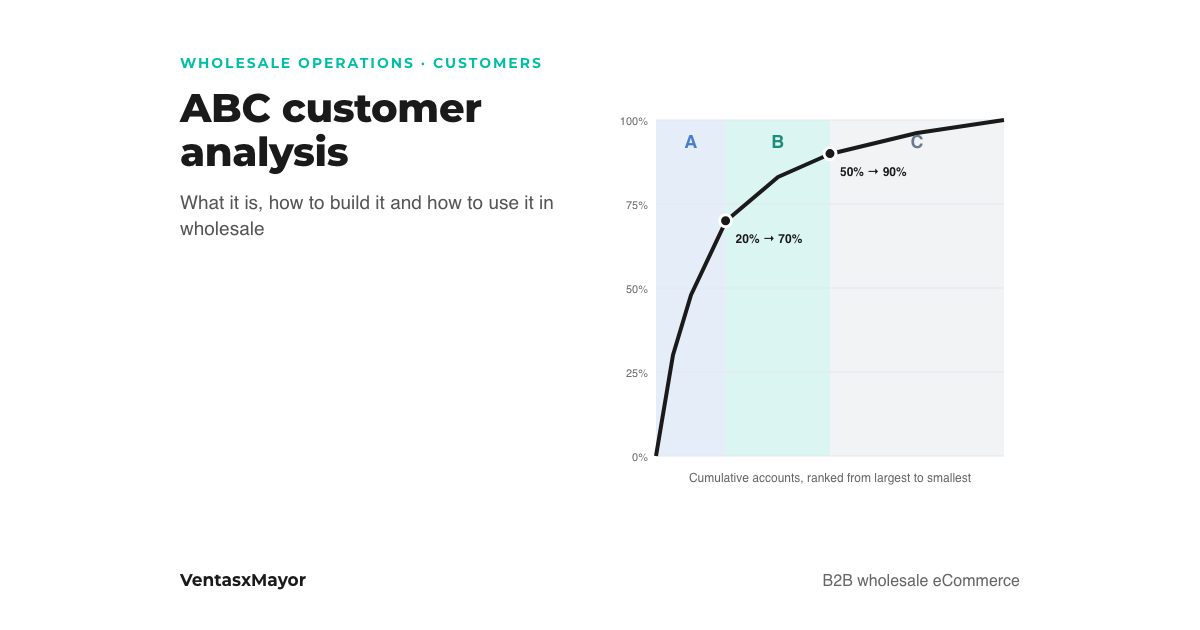
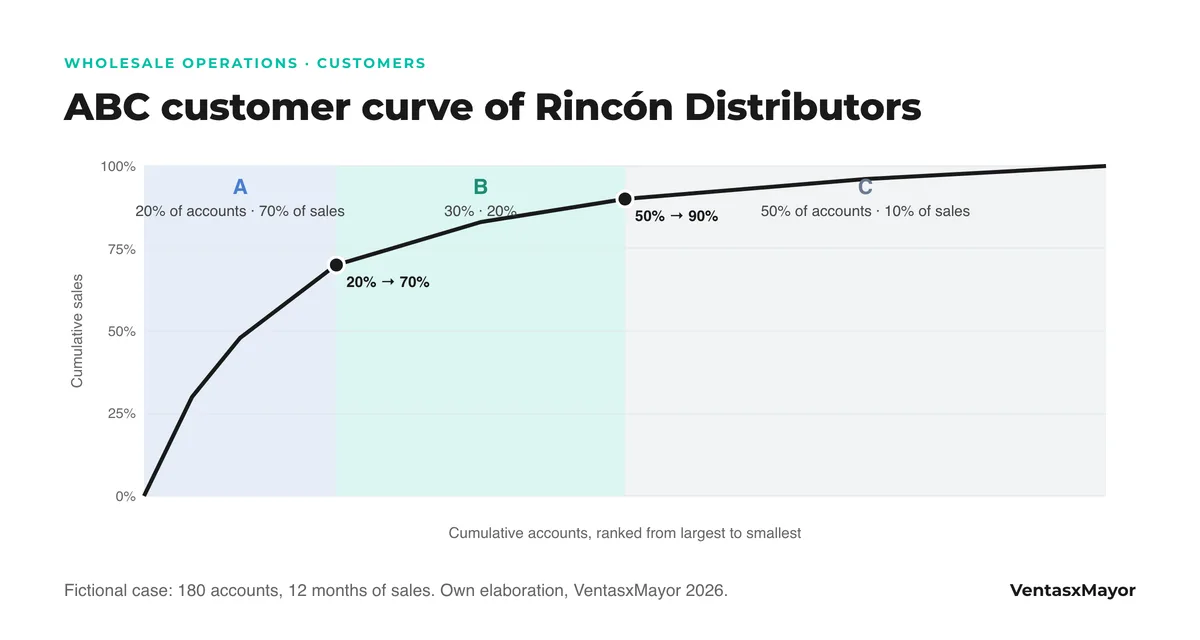
ABC analysis ranks customers from largest to smallest by what they buy and splits them into three classes: A, a few accounts that concentrate most of the sales; B, a middle group; and C, many accounts that buy little. It is based on the Pareto principle: a minority of causes explains the majority of effects.
The classic cut-offs are 80/15/5: A accounts explain 80% of sales, B the next 15% and C the final 5%. At a real distributor the numbers look more like 70/20/10, and what always surprises is the other half of the table: A accounts are usually 15 to 20% of customers, and C accounts, half. In other words: half the portfolio, half the visits and half the packing slips explain 10% of revenue.
The same curve applies to products (which SKUs drive sales, the subject of inventory turnover) and to suppliers. Here we talk about customers because that is where the most commercial decisions depend on it and where it is done least.
How to build ABC customer analysis in five steps
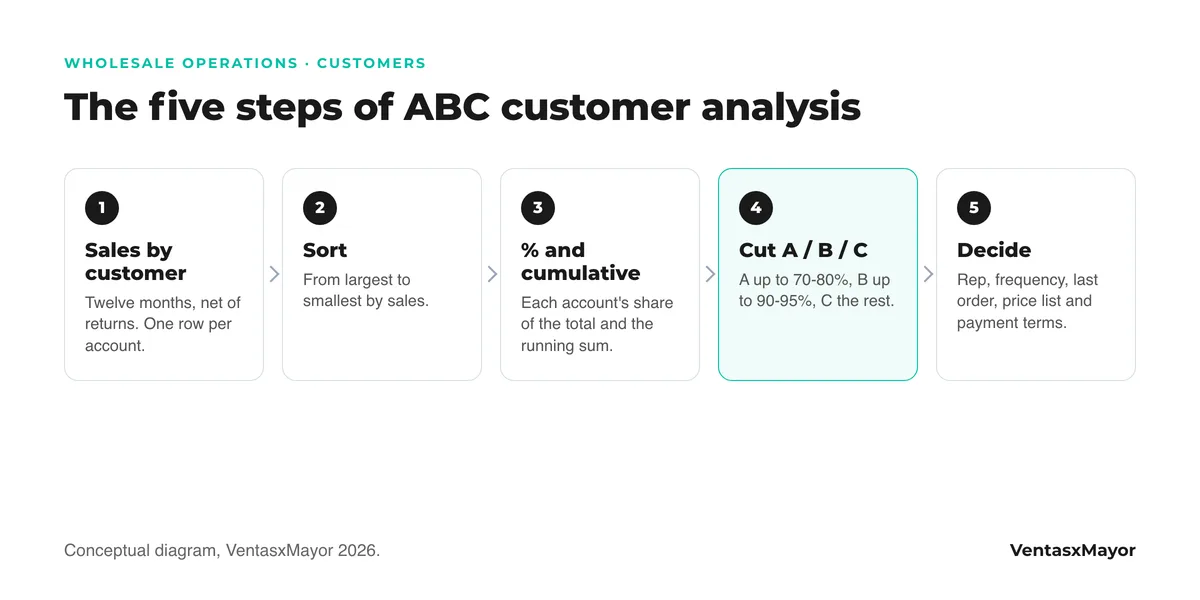
Only one thing is needed: sales by customer for the last twelve months, net of returns. If it is in the management system, export it; if orders came in over WhatsApp and were invoiced by hand, pull it from invoicing. With that, in a spreadsheet:
- One row per customer, one column with the period’s sales. Twelve months, so seasonality does not distort it. If a customer has several branches that buy separately, decide beforehand whether to count them together.
- Sort from largest to smallest by sales.
- Calculate each customer’s percentage of the total and, in the next column, the cumulative percentage: that customer plus all the ones above.
- Cut the classes. A: up to 70 or 80% cumulative. B: up to 90 or 95%. C: the rest. The cut-offs are not sacred; what matters is that the three classes get a different treatment.
- Add the columns that turn the list into decisions: assigned rep, order frequency, date of last order, price list, average discount and payment terms. Only then does the curve start to talk.
What to do with A, B and C accounts
The curve is useless if the conclusion is "A accounts are important". It is useful when each class gets a different treatment, and different does not mean better or worse: it means fitted to what that customer represents and what it costs to serve them.
| Class | Who they are | Service | Terms | Risk to watch |
|---|---|---|---|---|
| A | 15-20% of accounts, 70-80% of sales | Assigned rep, visit or call at a fixed frequency, the owner’s attention when needed | Own price list, credit, priority on stock and delivery | Dependence: losing one hurts. An A account down 20% is an alert the same month |
| B | 25-30% of accounts, 15-20% of sales | Assigned rep, biweekly or monthly contact; goal of moving them up to A | Standard list with volume discounts that reward growth | Stagnation: the B account that always buys the same is an A that was never developed |
| C | 50% of accounts, 5-10% of sales | No routine visits: they order alone through the portal or the catalog, the rep steps in by exception | Standard list, prepaid or cash terms, strict minimum order | Hidden cost: every visit, small delivery and discount to a C account comes out of the A accounts’ margin |
Class C does not mean disposable customer. A C account can be a new store that has not grown yet, a branch of an A account or a seasonal buyer. The curve says how much they buy today, not how much they could; that is why the "customer since" and "last order" columns are worth as much as the sales column.
The mistakes that make the ABC curve useless
- Building it once a year. An A account that stops ordering in March gets discovered in January. The curve has to be recalculated at least quarterly, and the signal "A account with no orders in 30 days" has to arrive on its own.
- Looking only at revenue. An A account buying at 25% off and paying in 90 days can leave less margin than a B account paying upfront. A second curve by contribution margin reshuffles several positions.
- Serving everyone the same. The most expensive mistake and the most common: the rep visits all 180 because "it was always like that", and the time spent on C accounts is paid for by the relationship with the A accounts.
- Not crossing it with the rep’s portfolio. The curve per rep shows who holds A accounts and who holds 60 C accounts: that explains commission differences that looked like effort.
- Not having sales by customer. If orders came in over WhatsApp and were invoiced by hand, sales by customer do not exist or are wrong. The curve does not fix data that is not there.
How VentasxMayor solves it
ABC analysis needs two things a wholesale platform has out of the box: real sales by customer and a channel for C accounts to order on their own. In VentasxMayor the reports show who bought, how much and what, and the customer funnel separates the one who signed up from the one who buys; each rep logs in with their own user and sees only their portfolio, so the curve per rep comes out on its own. C accounts order from the portal with their price list and minimum, no visit required; and Autoseller flags the rep when a customer stops buying or abandons a cart, which is the signal the January curve never gives in time.
Checklist to build it this week
- Export sales by customer for the last twelve months, net of returns.
- Sort, calculate percentage and cumulative, cut A/B/C.
- Add assigned rep, frequency, last order, price list and payment terms.
- Flag A accounts with no assigned rep and assign one.
- Flag A accounts with no order in the last 30 days and call them this week.
- Take C accounts inactive for over 90 days off the visit route; move them to catalog or portal contact.
- Check that the highest discounts sit with A or B accounts, not C.
- Pick five B accounts with potential and set a goal to move them up to A.
- Set a date to recalculate the curve in three months.
Frequently asked questions about ABC analysis
What is the ABC curve and what is it for?+
It is a classification method based on the Pareto principle: it ranks customers, products or suppliers by their weight in sales and splits them into three classes (A, B and C) to give each a different treatment. It is used to decide where to put the rep’s time, credit, stock and discounts.
What are the ABC curve percentages?+
The classic ones are 80/15/5 (A, B and C on cumulative sales), although real distributors tend to see 70/20/10. In number of accounts, A are around 20%, B 30% and C 50%. The cut-offs adapt to the business; what does not adapt is that each class gets a different treatment.
How do I build the ABC curve in Excel?+
One column with the customer, another with twelve months of sales; sort from largest to smallest; a column with sales divided by the total; another with the running sum of that column; and a last one with a formula like "if cumulative is 70% or less, A; if 90% or less, B; otherwise C". Then add rep, last order and payment terms.
Should C accounts stop being served?+
No: they should be served differently. A C account that buys little does not justify a weekly visit, but it does justify a portal where it orders alone, an up-to-date catalog and a clear minimum order. The rep steps in by exception: when the C account grows, complains or stops ordering.
Sources
Next step
Who bought, how much and who stopped ordering
In VentasxMayor sales by customer come out of the system, each rep sees their own portfolio, C accounts order alone from the portal and Autoseller flags the customer who stops buying. The ABC curve stops being a January spreadsheet.
What is a pre-sell rep: the job, the pay and how online ordering changes it
The pre-sell rep visits stores on a fixed route and takes the order the delivery route ships later. The job, the pay, how it differs from van sales and how distributors run pre-sell.

Wholesale stock control: how to measure turnover and stop losing money on your inventory
Learn how to calculate stock rotation index, identify dead products and apply strategies to optimize your wholesale inventory.

B2B customer portal: what it is, what it needs and how to roll it out
What a B2B customer portal is, what it needs for a wholesaler, how it differs from a rep portal and an online store, and how to launch it in five steps.